

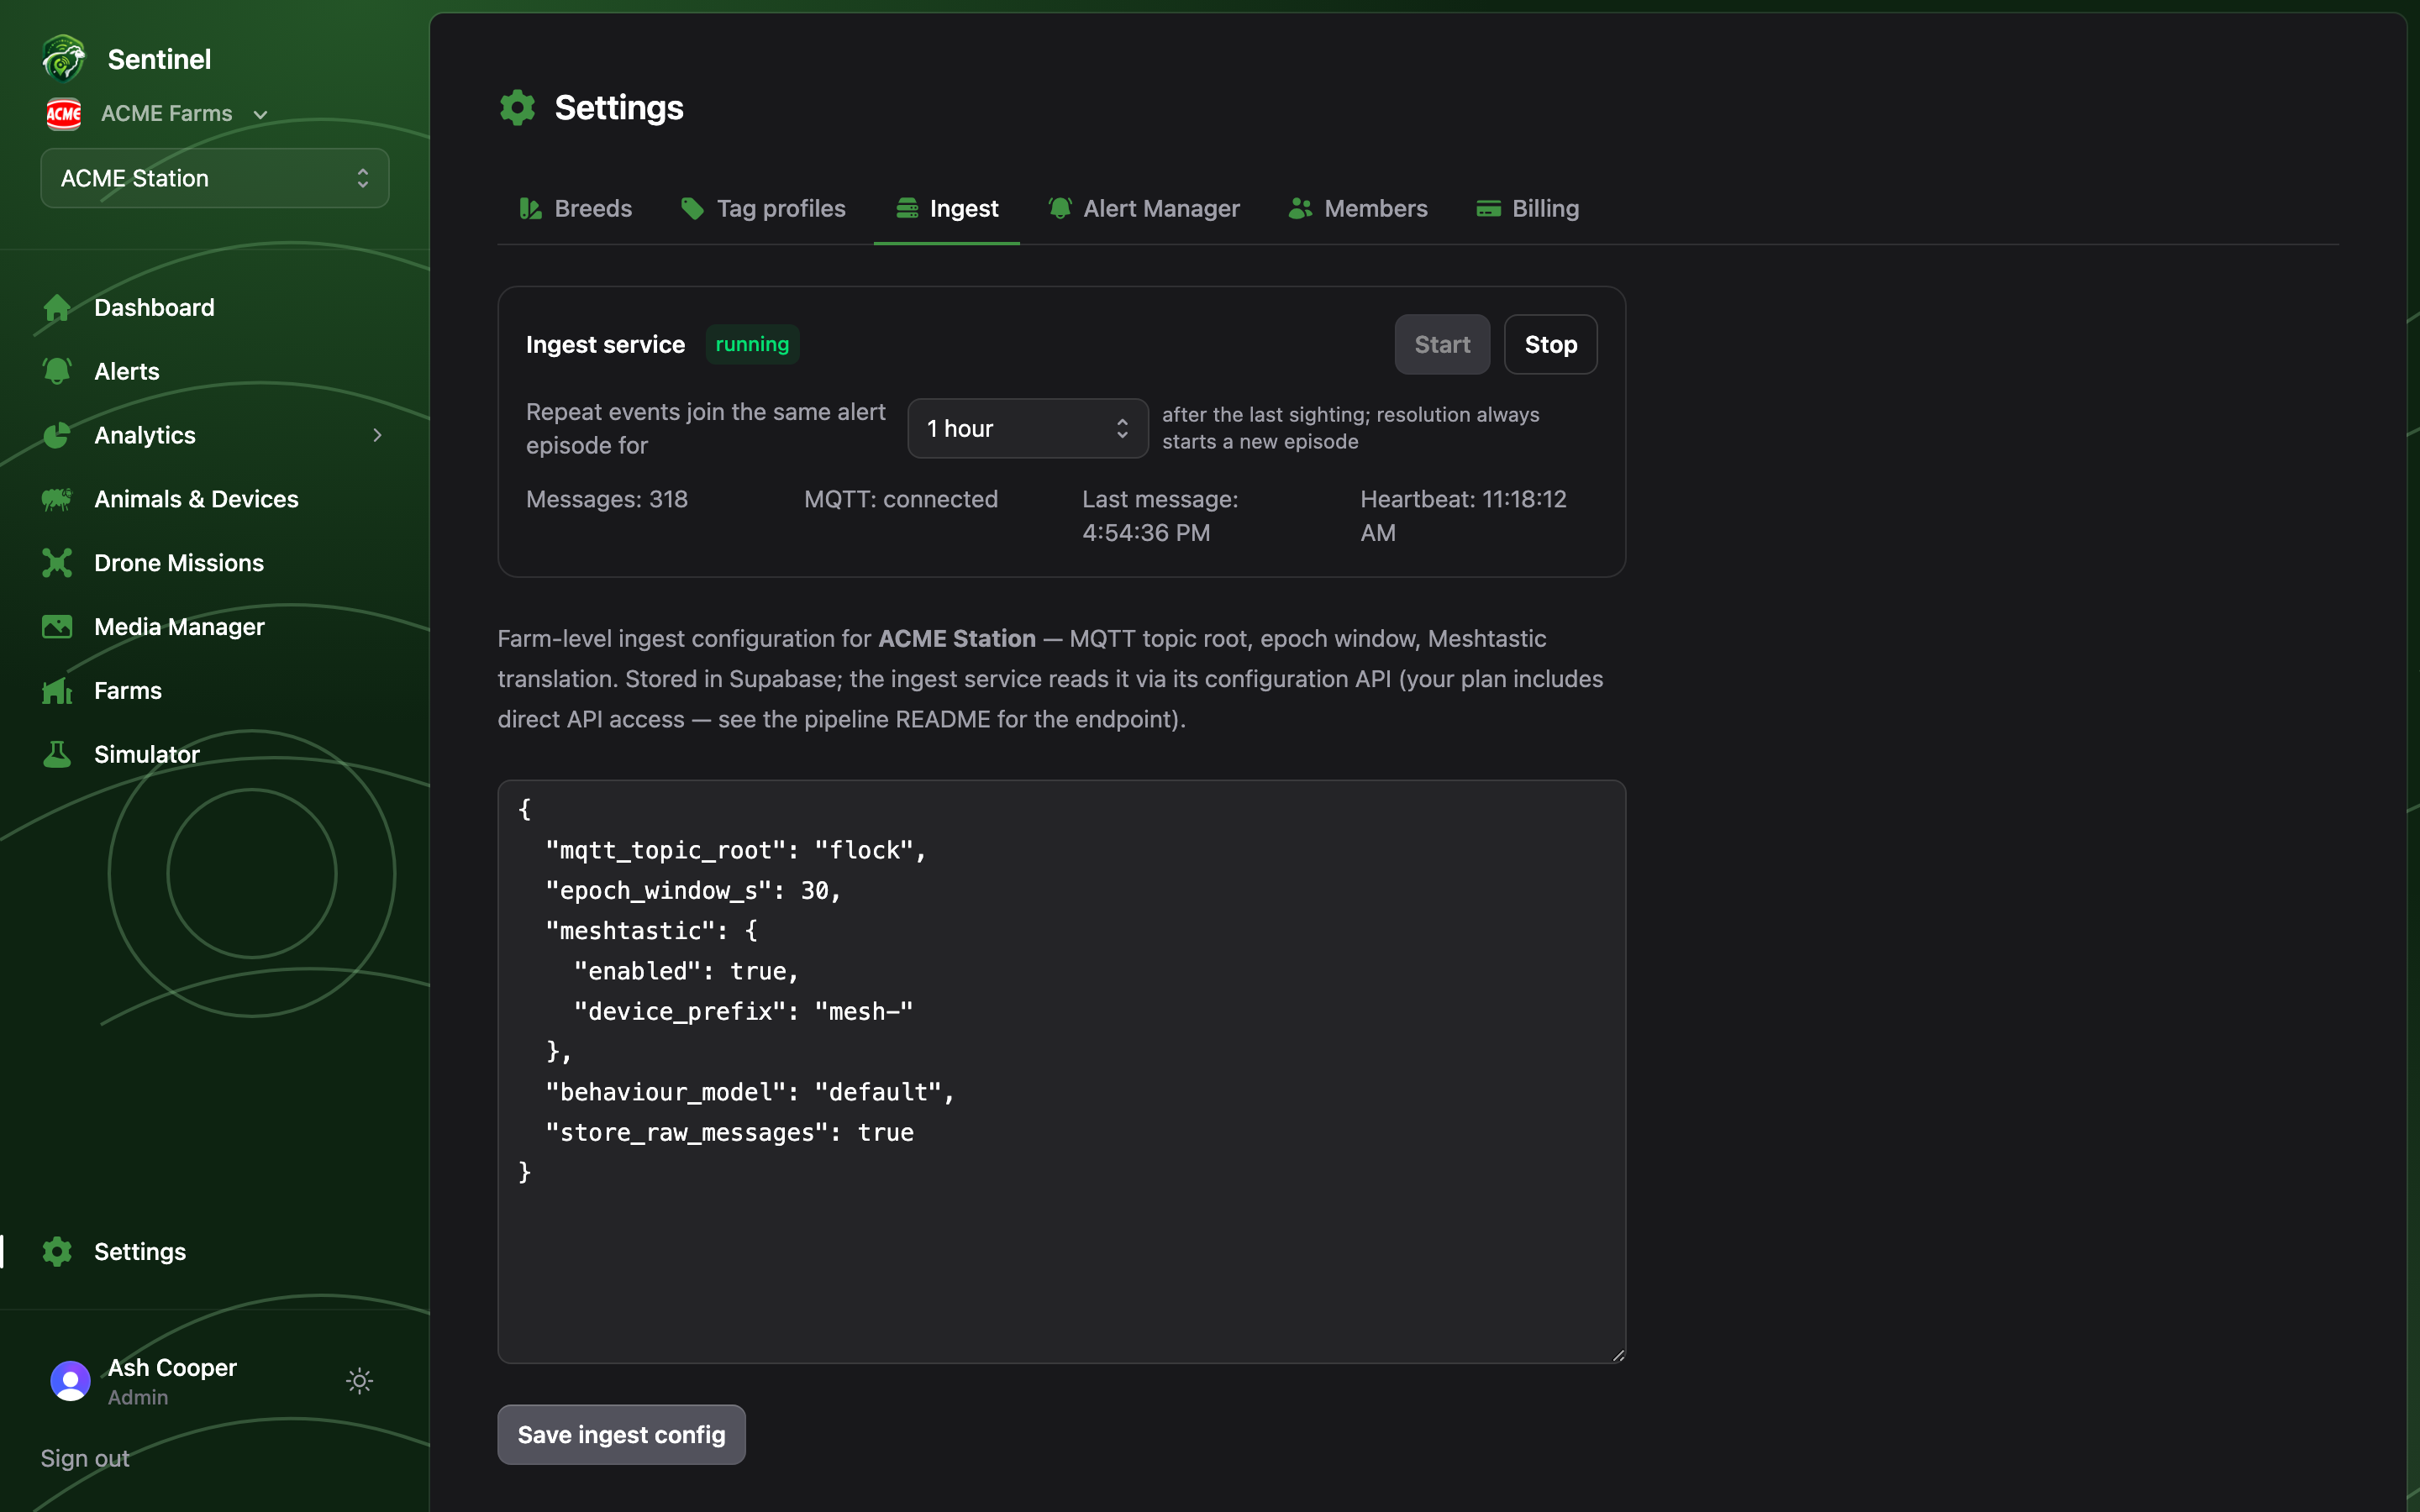
The service panel
The status card shows the service’s live state — running, stopped, error, or offline when no heartbeat has arrived (the card then shows the command to start the process on its host). While running you see message counts, MQTT connection state, and the last message time. Start and Stop work through the database: the app records the desired state, and the service’s supervisor converges within seconds. Control flows through Postgres, so the browser needs no network path to the farm.Alert episode window
The inline control — “Repeat events join the same alert episode for …” — sets how long repeats of the same event stack onto one alert (15 minutes to 24 hours, default 1 hour). Resolution always starts a fresh episode, so a re-cast ewe alerts again.Farm-level configuration
Below the panel, each farm has a JSON config the ingest reads live:Plans with API access can also read and write the effective config bundle (farm
config + tag profiles + breeds + device map) over the service’s HTTP API — see the
pipeline README in the repository.