

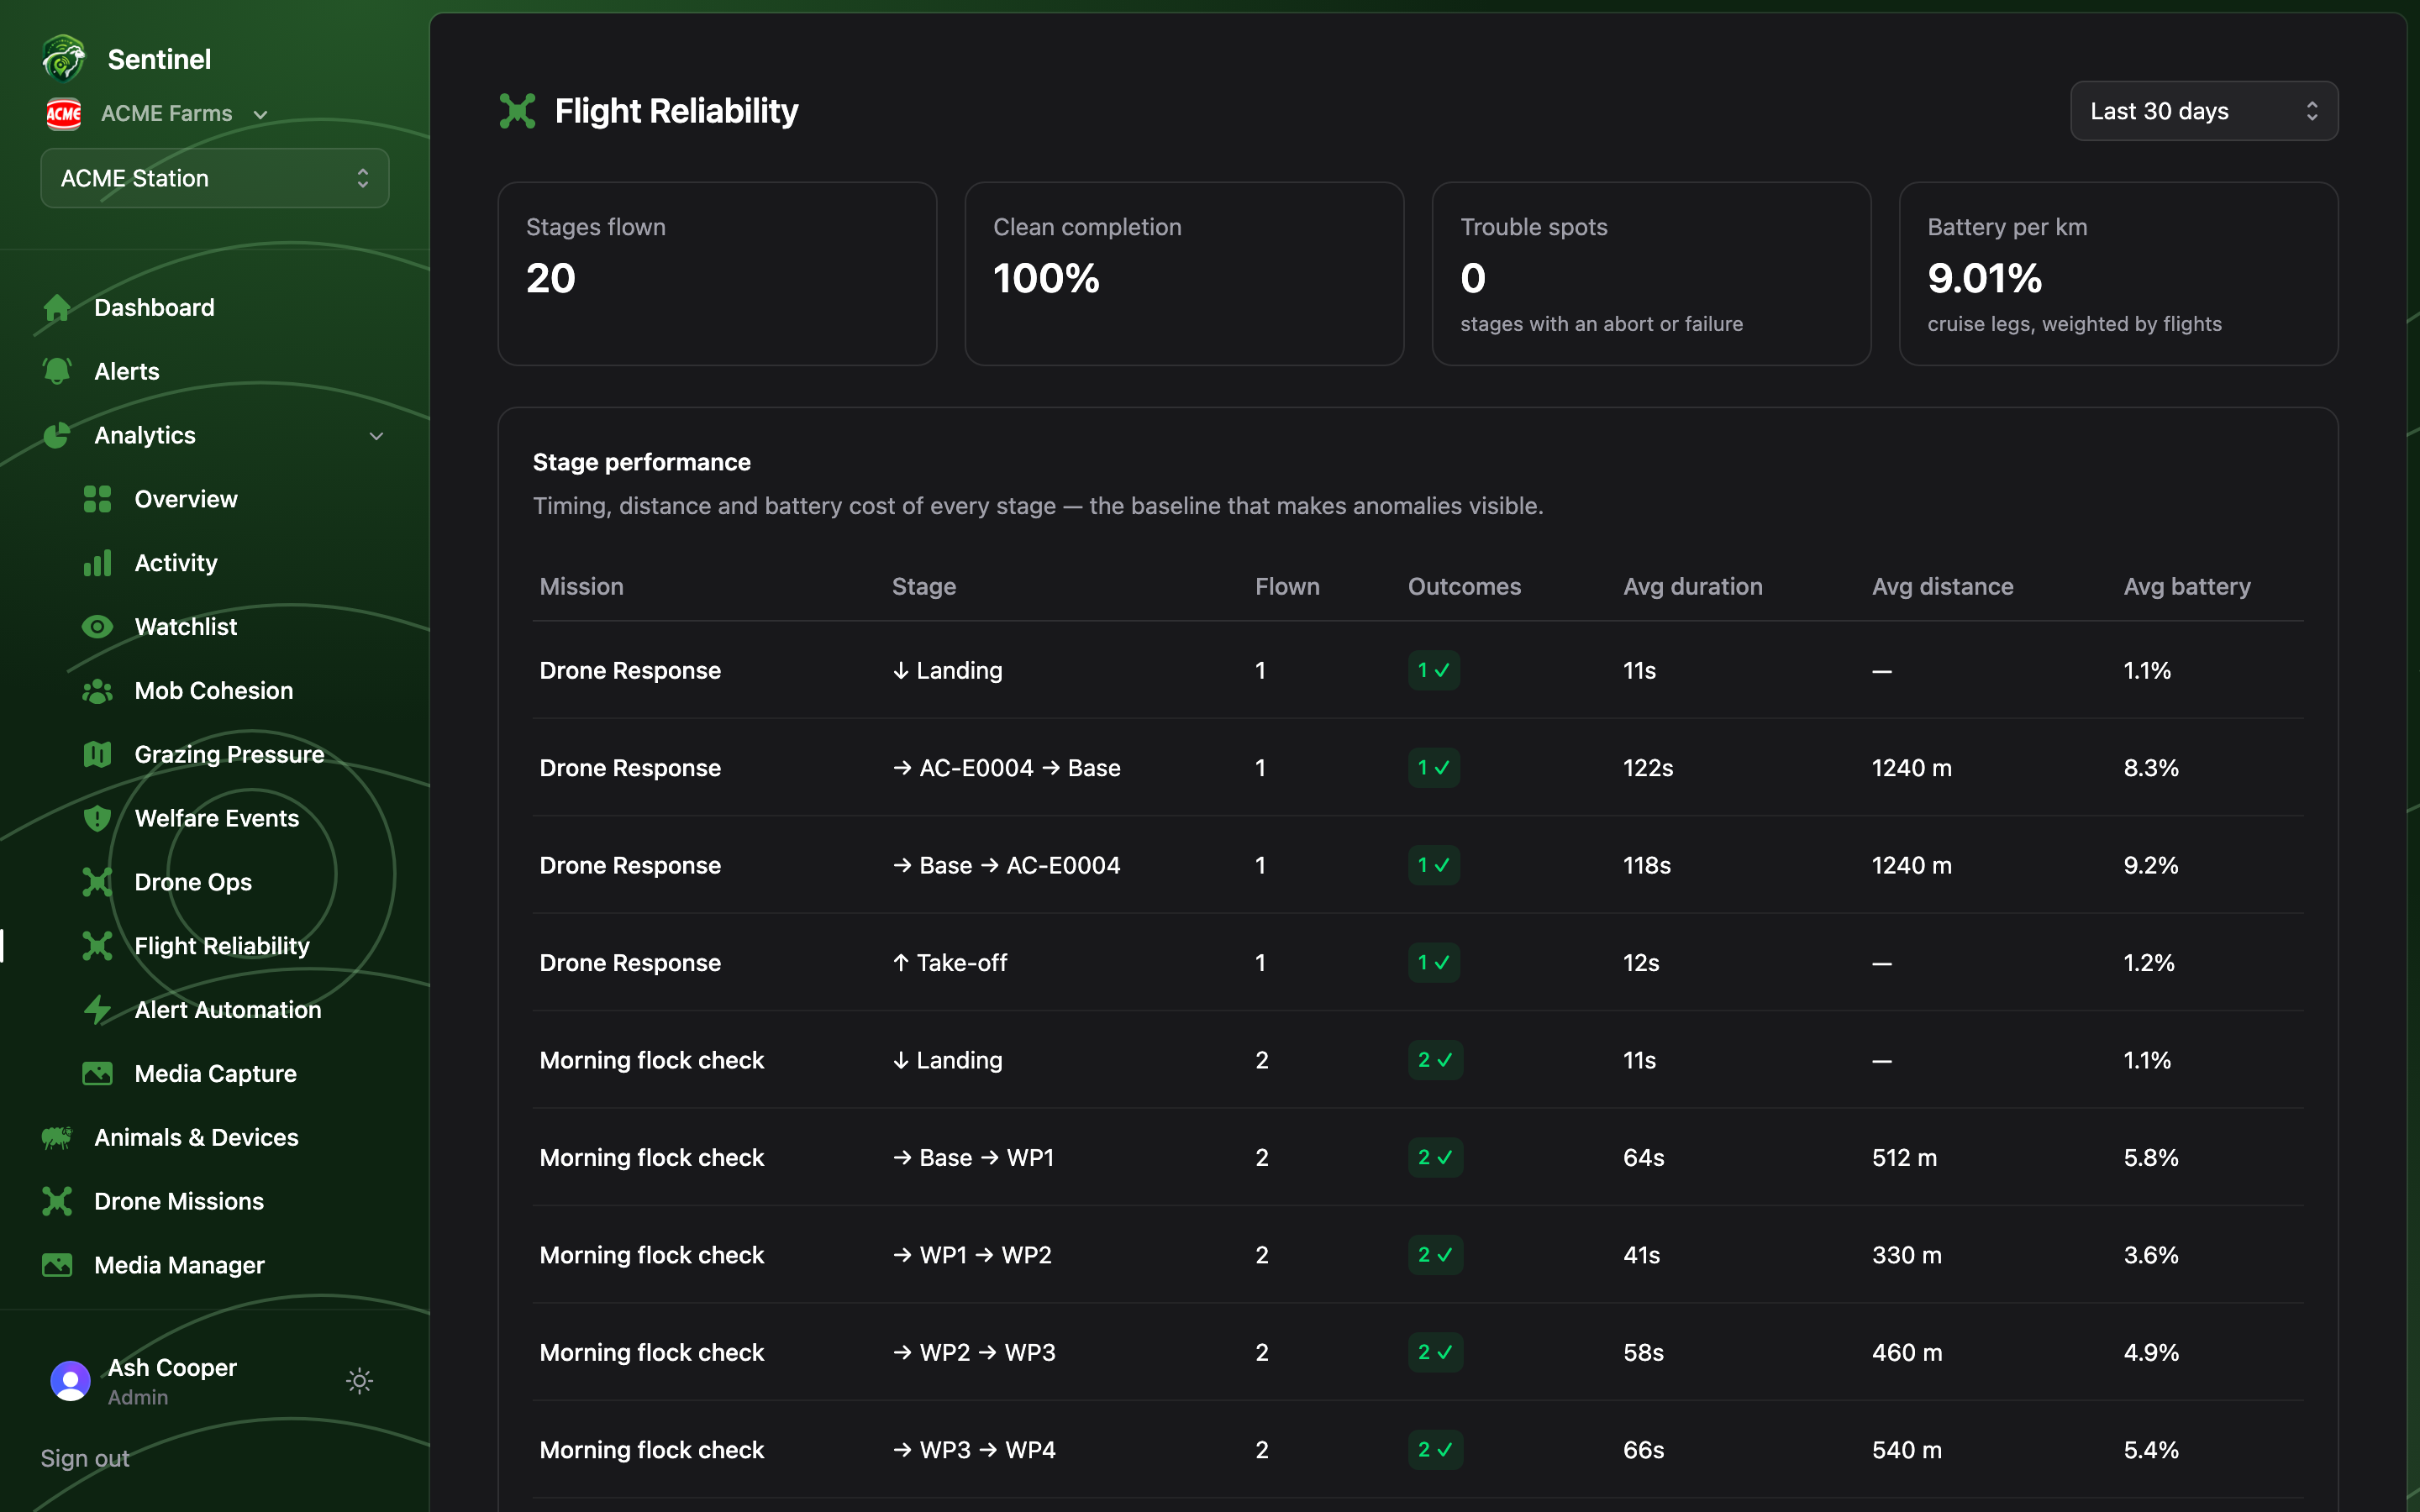
The headline cards
Stages flown, clean completion rate, trouble spots (stages with at least one abort or failure), and battery per km — cruise-leg battery burn weighted by flights, the number that tells you whether a mission is over-reaching the aircraft.Where flights go wrong
When failures exist, this table names them: mission, stage, how often it flew, and how often it aborted or failed there. A mission that keeps failing on the same long leg into the gully is a route problem; failures spread across landings are an aircraft or site problem.Stage performance
The full per-mission, per-stage table: flights, outcomes, average duration, distance and battery draw. Use it when re-planning a route — if one leg burns twice the battery of any other, that’s the leg to split or lower.The default window here is 30 days — reliability patterns need more flights than a
week provides.