

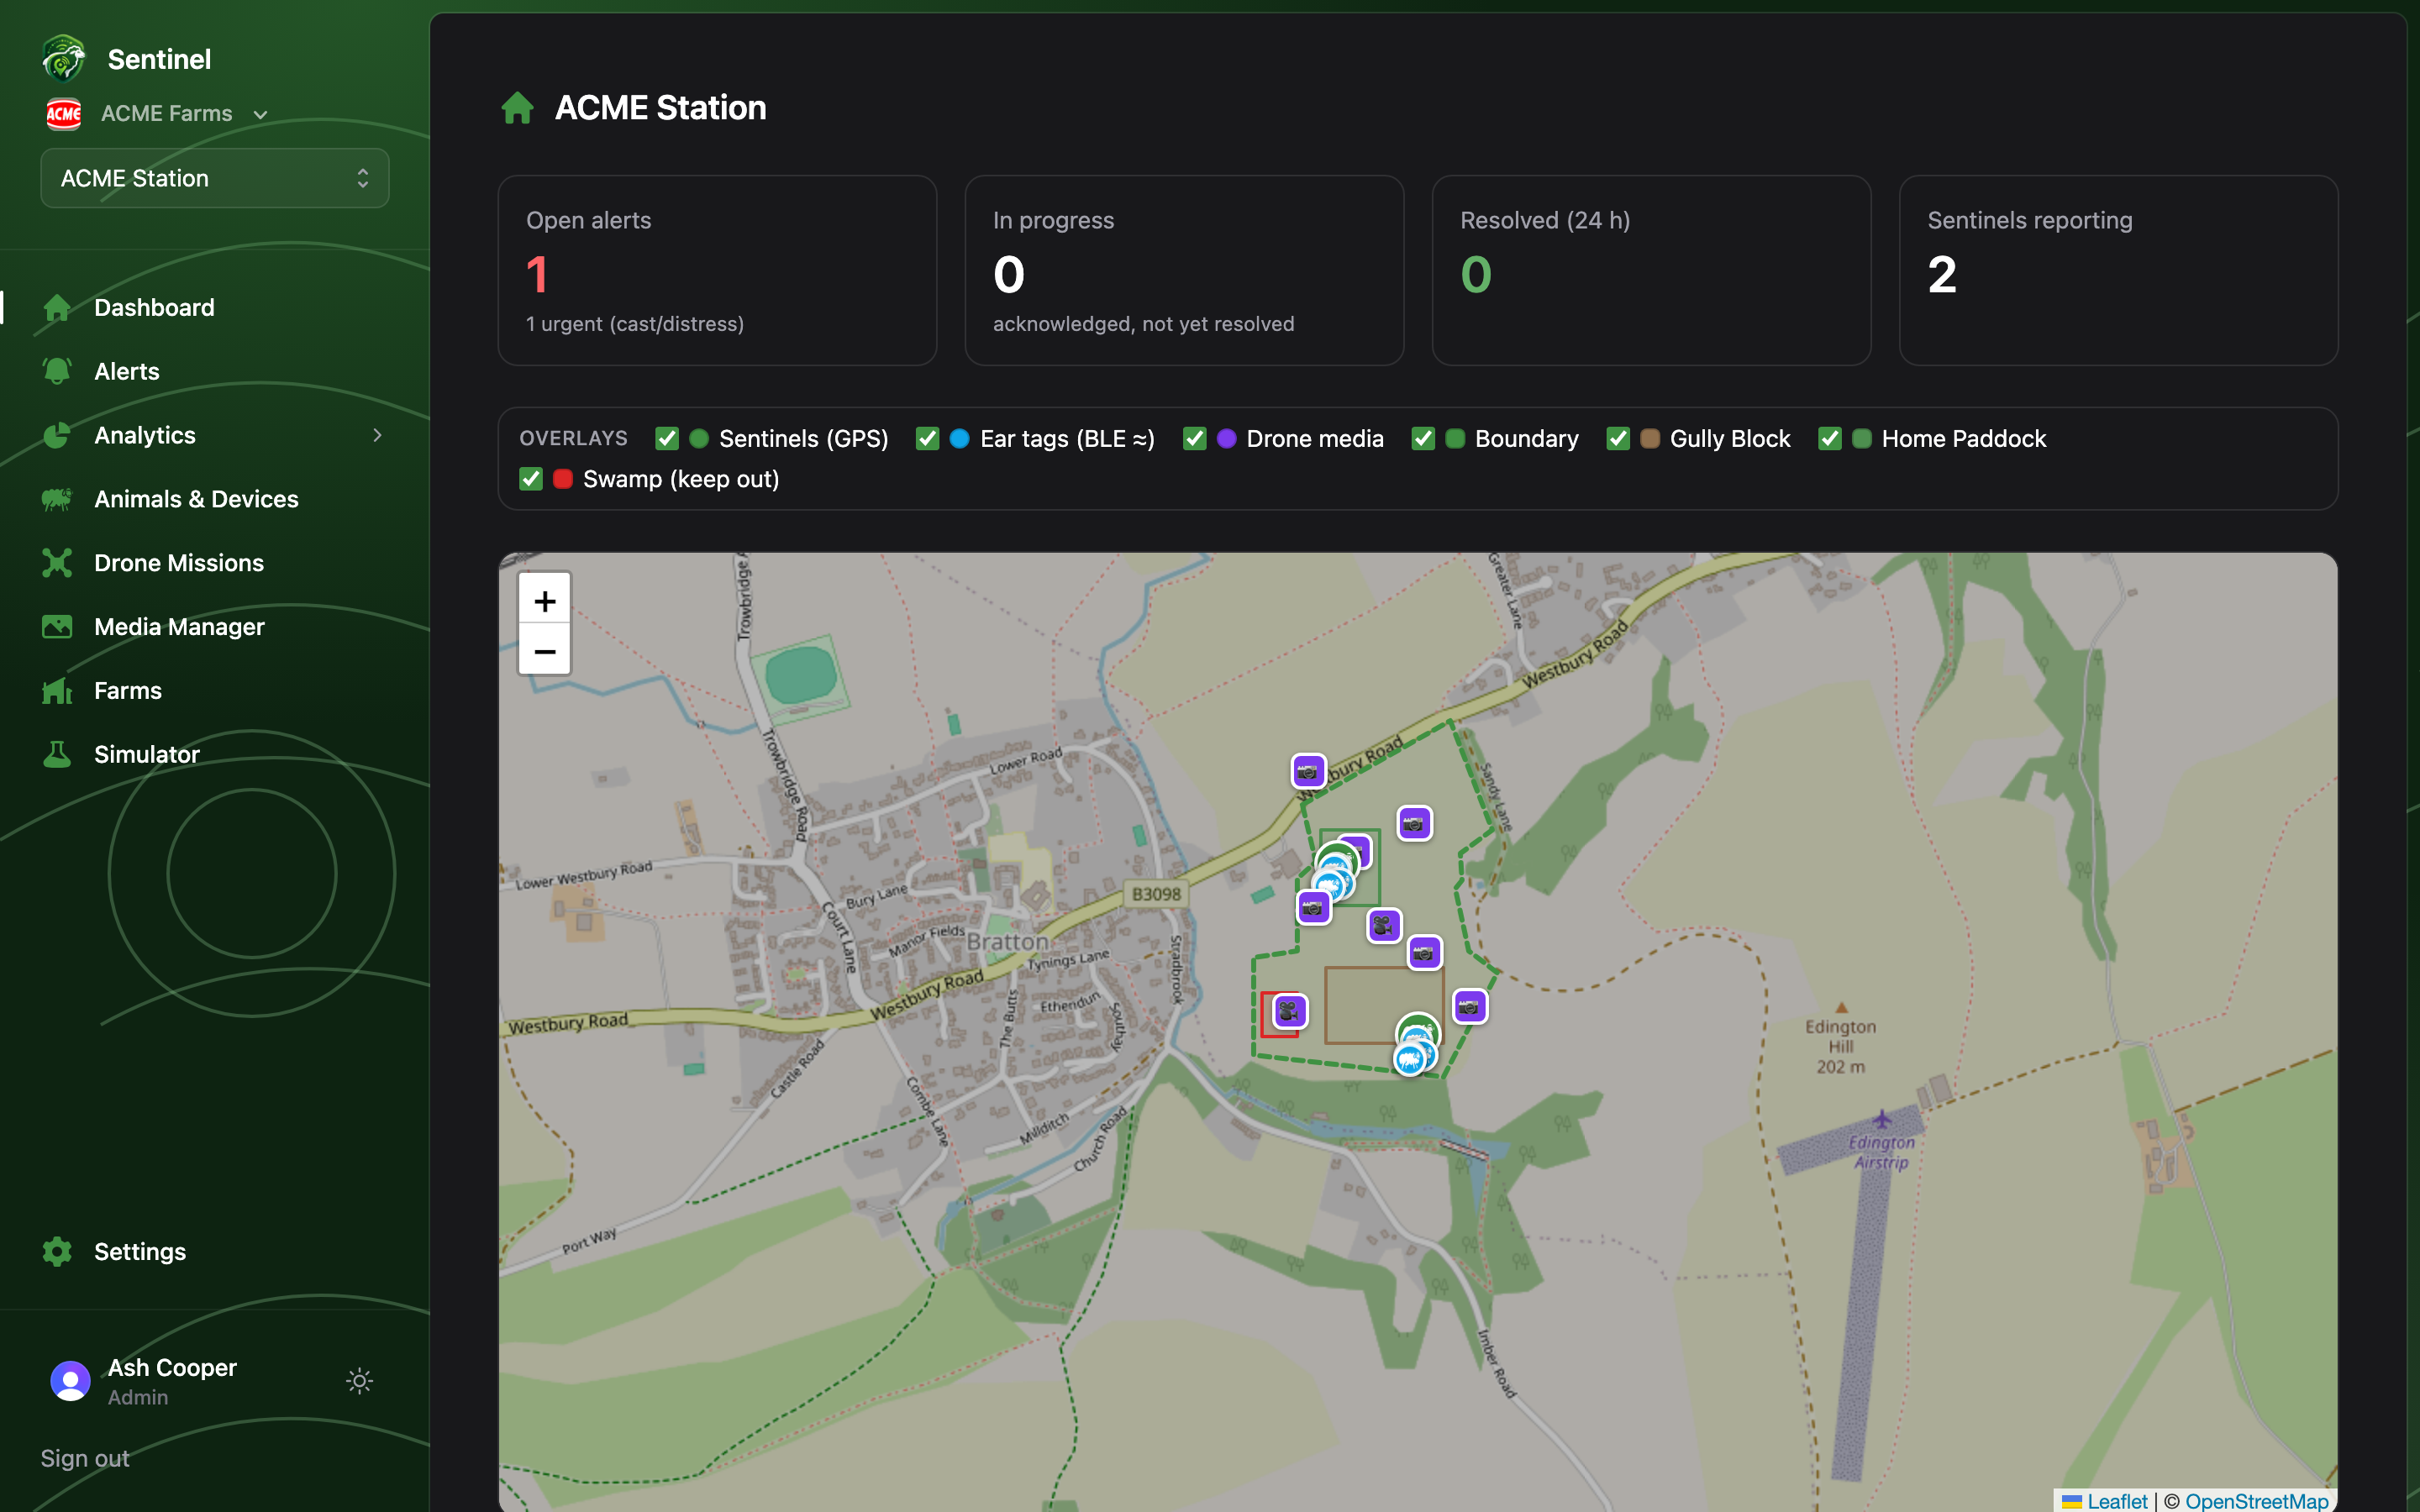
Headline numbers
Four stat cards across the top:- Open alerts — turns red when anything urgent (cast or distress) is open.
- In progress — acknowledged but not yet resolved.
- Resolved (24 h) — what the team has closed out today.
- Sentinels reporting — GPS collars heard from recently.
The live map
The map shows the property boundary and fields, with a sheep marker per sentinel collar — green normally, red when that device has an unresolved alert. Click a marker for the device id, last fix time and battery voltage. Ear tags render as approximate presence around the sentinel that last heard them. Use the Overlays row to toggle layers: sentinels, ear tags, drone media capture points (when recent captures exist), the boundary, and each named field.With the Realtime updates plan feature, positions and alerts push to the map the
moment they land; otherwise the dashboard refreshes every 15 seconds.
Needs attention
Below the map, Needs attention lists the most recent unresolved alerts — device, kind, when (repeats collapse into one row with an occurrence count), status, and any automated actions already taken (webhook notified, drone launched). From here you can:- Acknowledge — tell the team you’ve seen it.
- Resolve — open the guided resolve flow and record the outcome (see Alerts).