

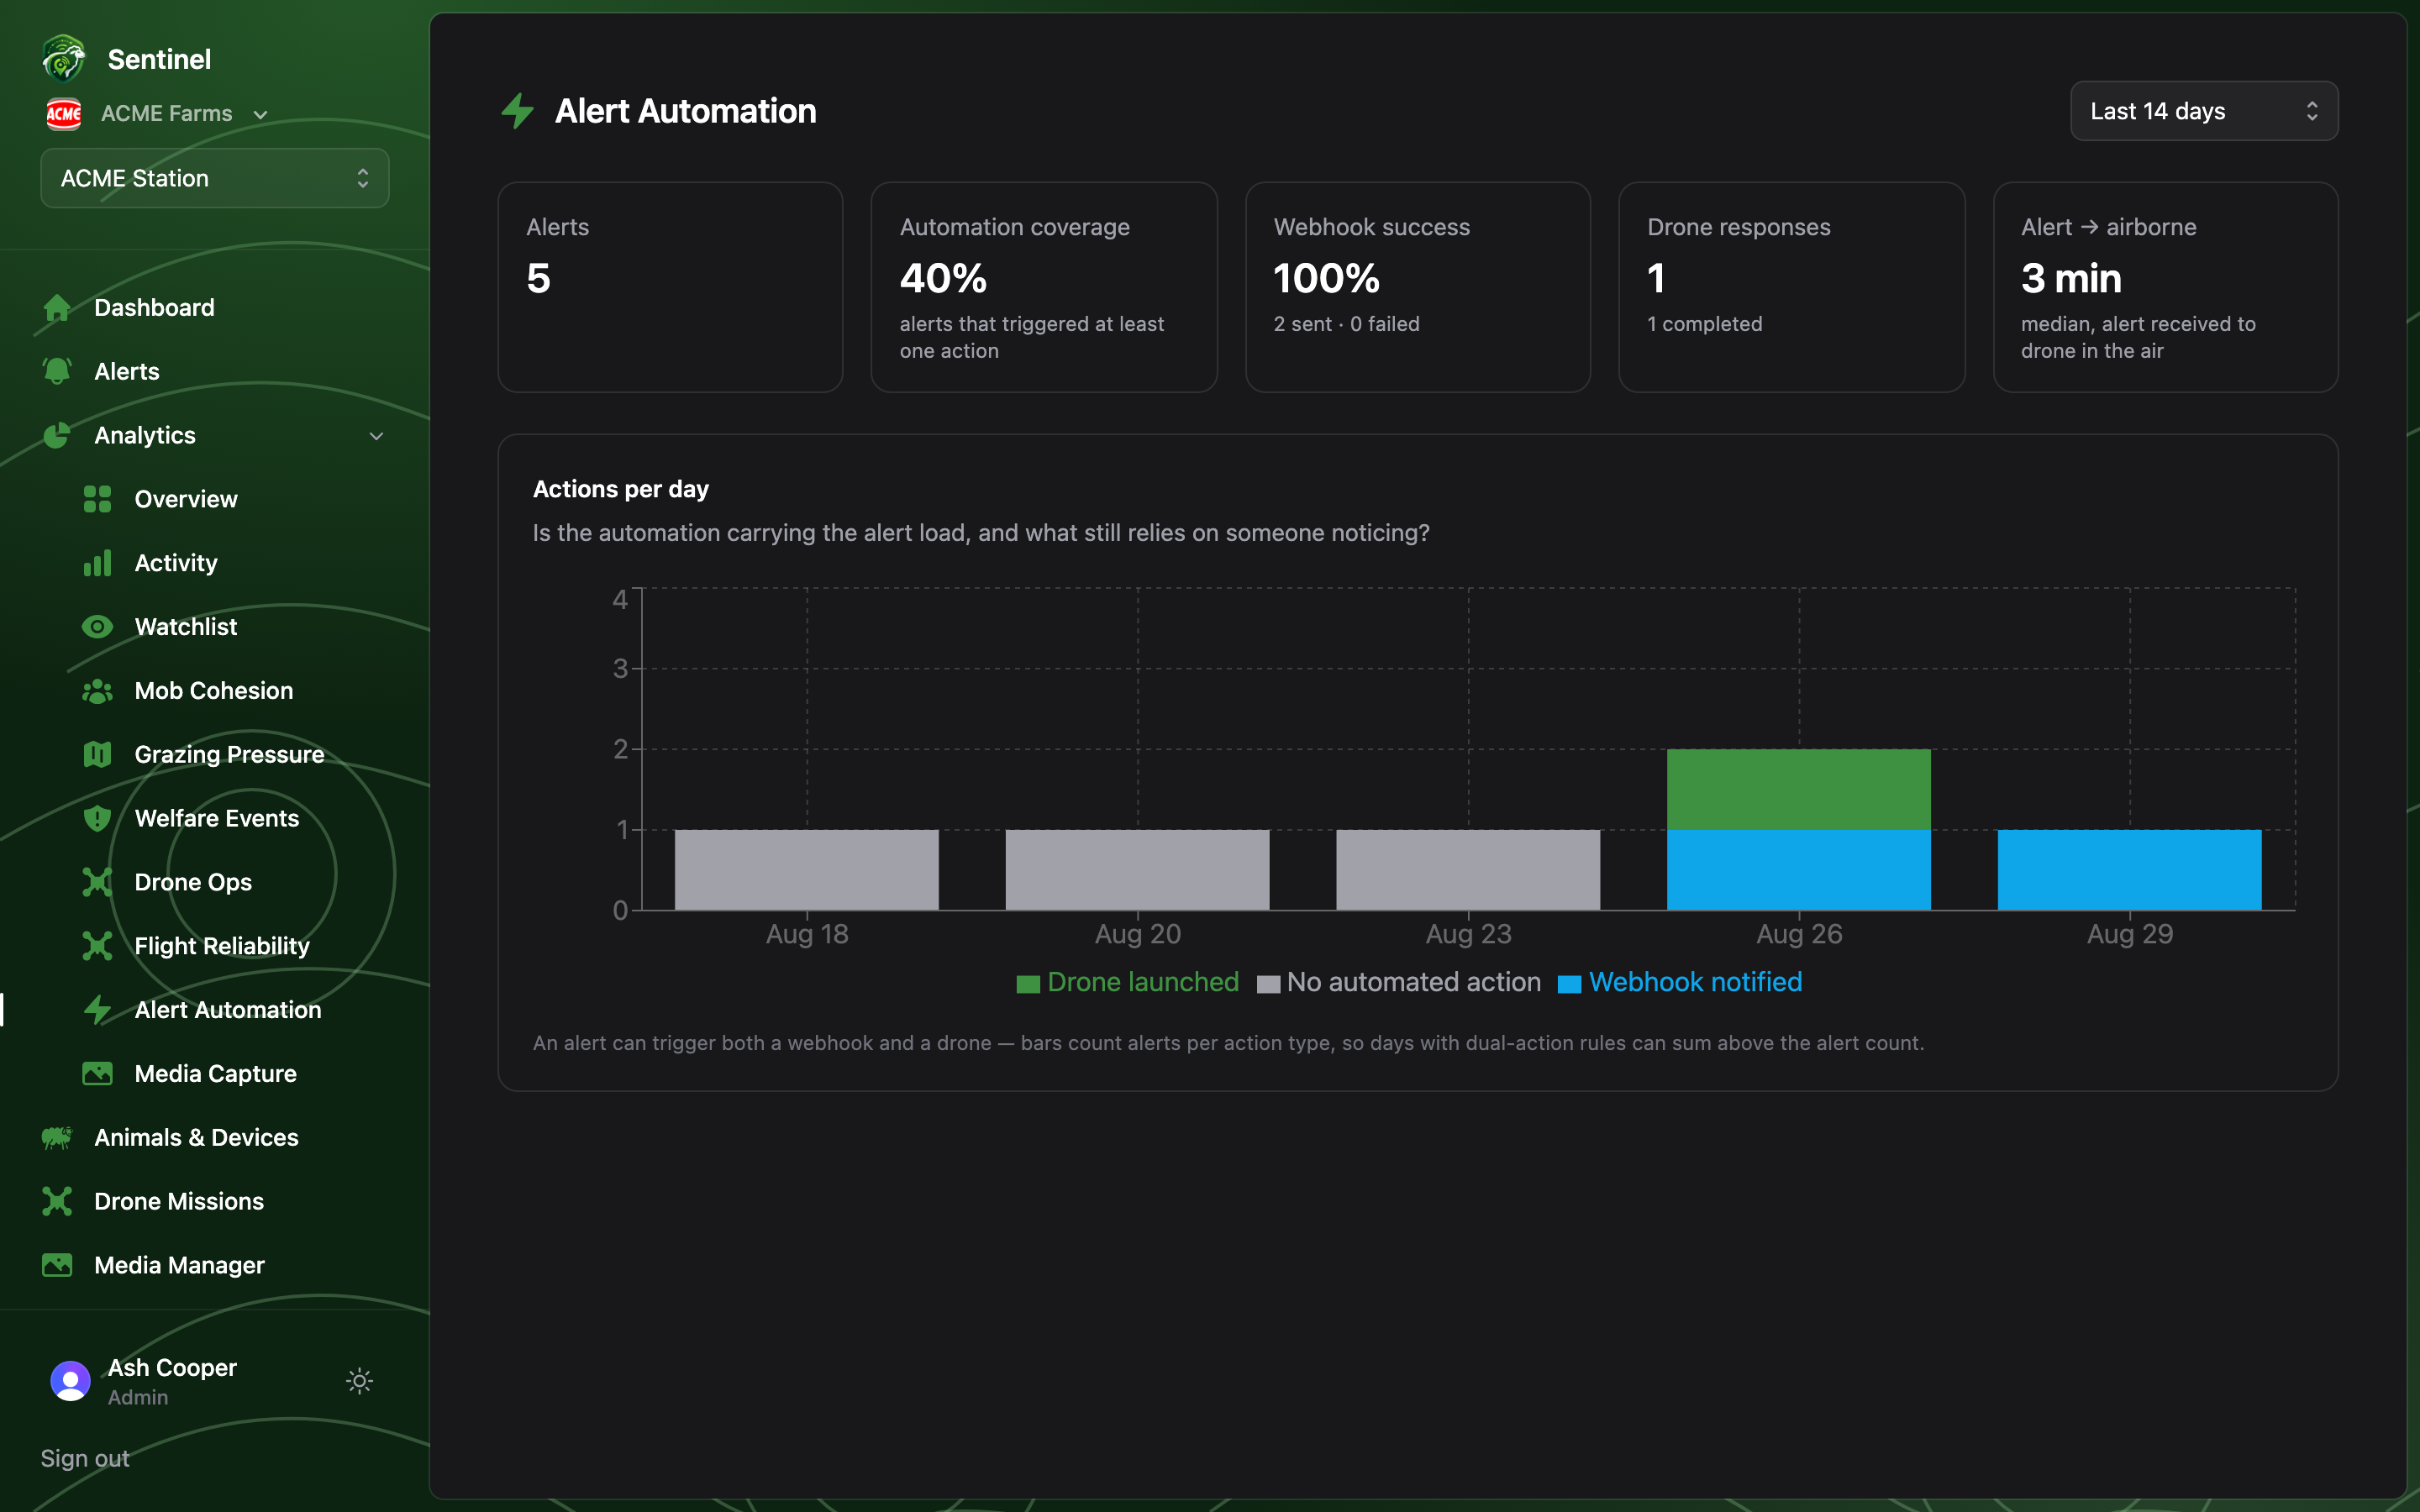
Alert Automation audits the Alert Manager: of everything the system raised, how much triggered an automated response — and how much fell through.
Alert Automation: coverage stat cards and the actions-per-day chart

The headline cards

  • Alerts in the window, and automation coverage — the share that triggered at least one action.
  • Webhook success — sent vs failed deliveries.
  • Drone responses — response flights launched, and how many completed.
  • Alert → airborne — the median from alert received to drone in the air.

Actions per day

Each day’s alerts stack into three bands: webhook notified, drone launched, and — the one to watch — no automated action. A persistent grey band means alert kinds (or a farm) that no rule covers.
Coverage below 100% isn’t automatically a problem — heartbeats rarely deserve a webhook. But if cast or distress events are landing in the “no automated action” band, fix the rules today: those are the events where minutes matter.