

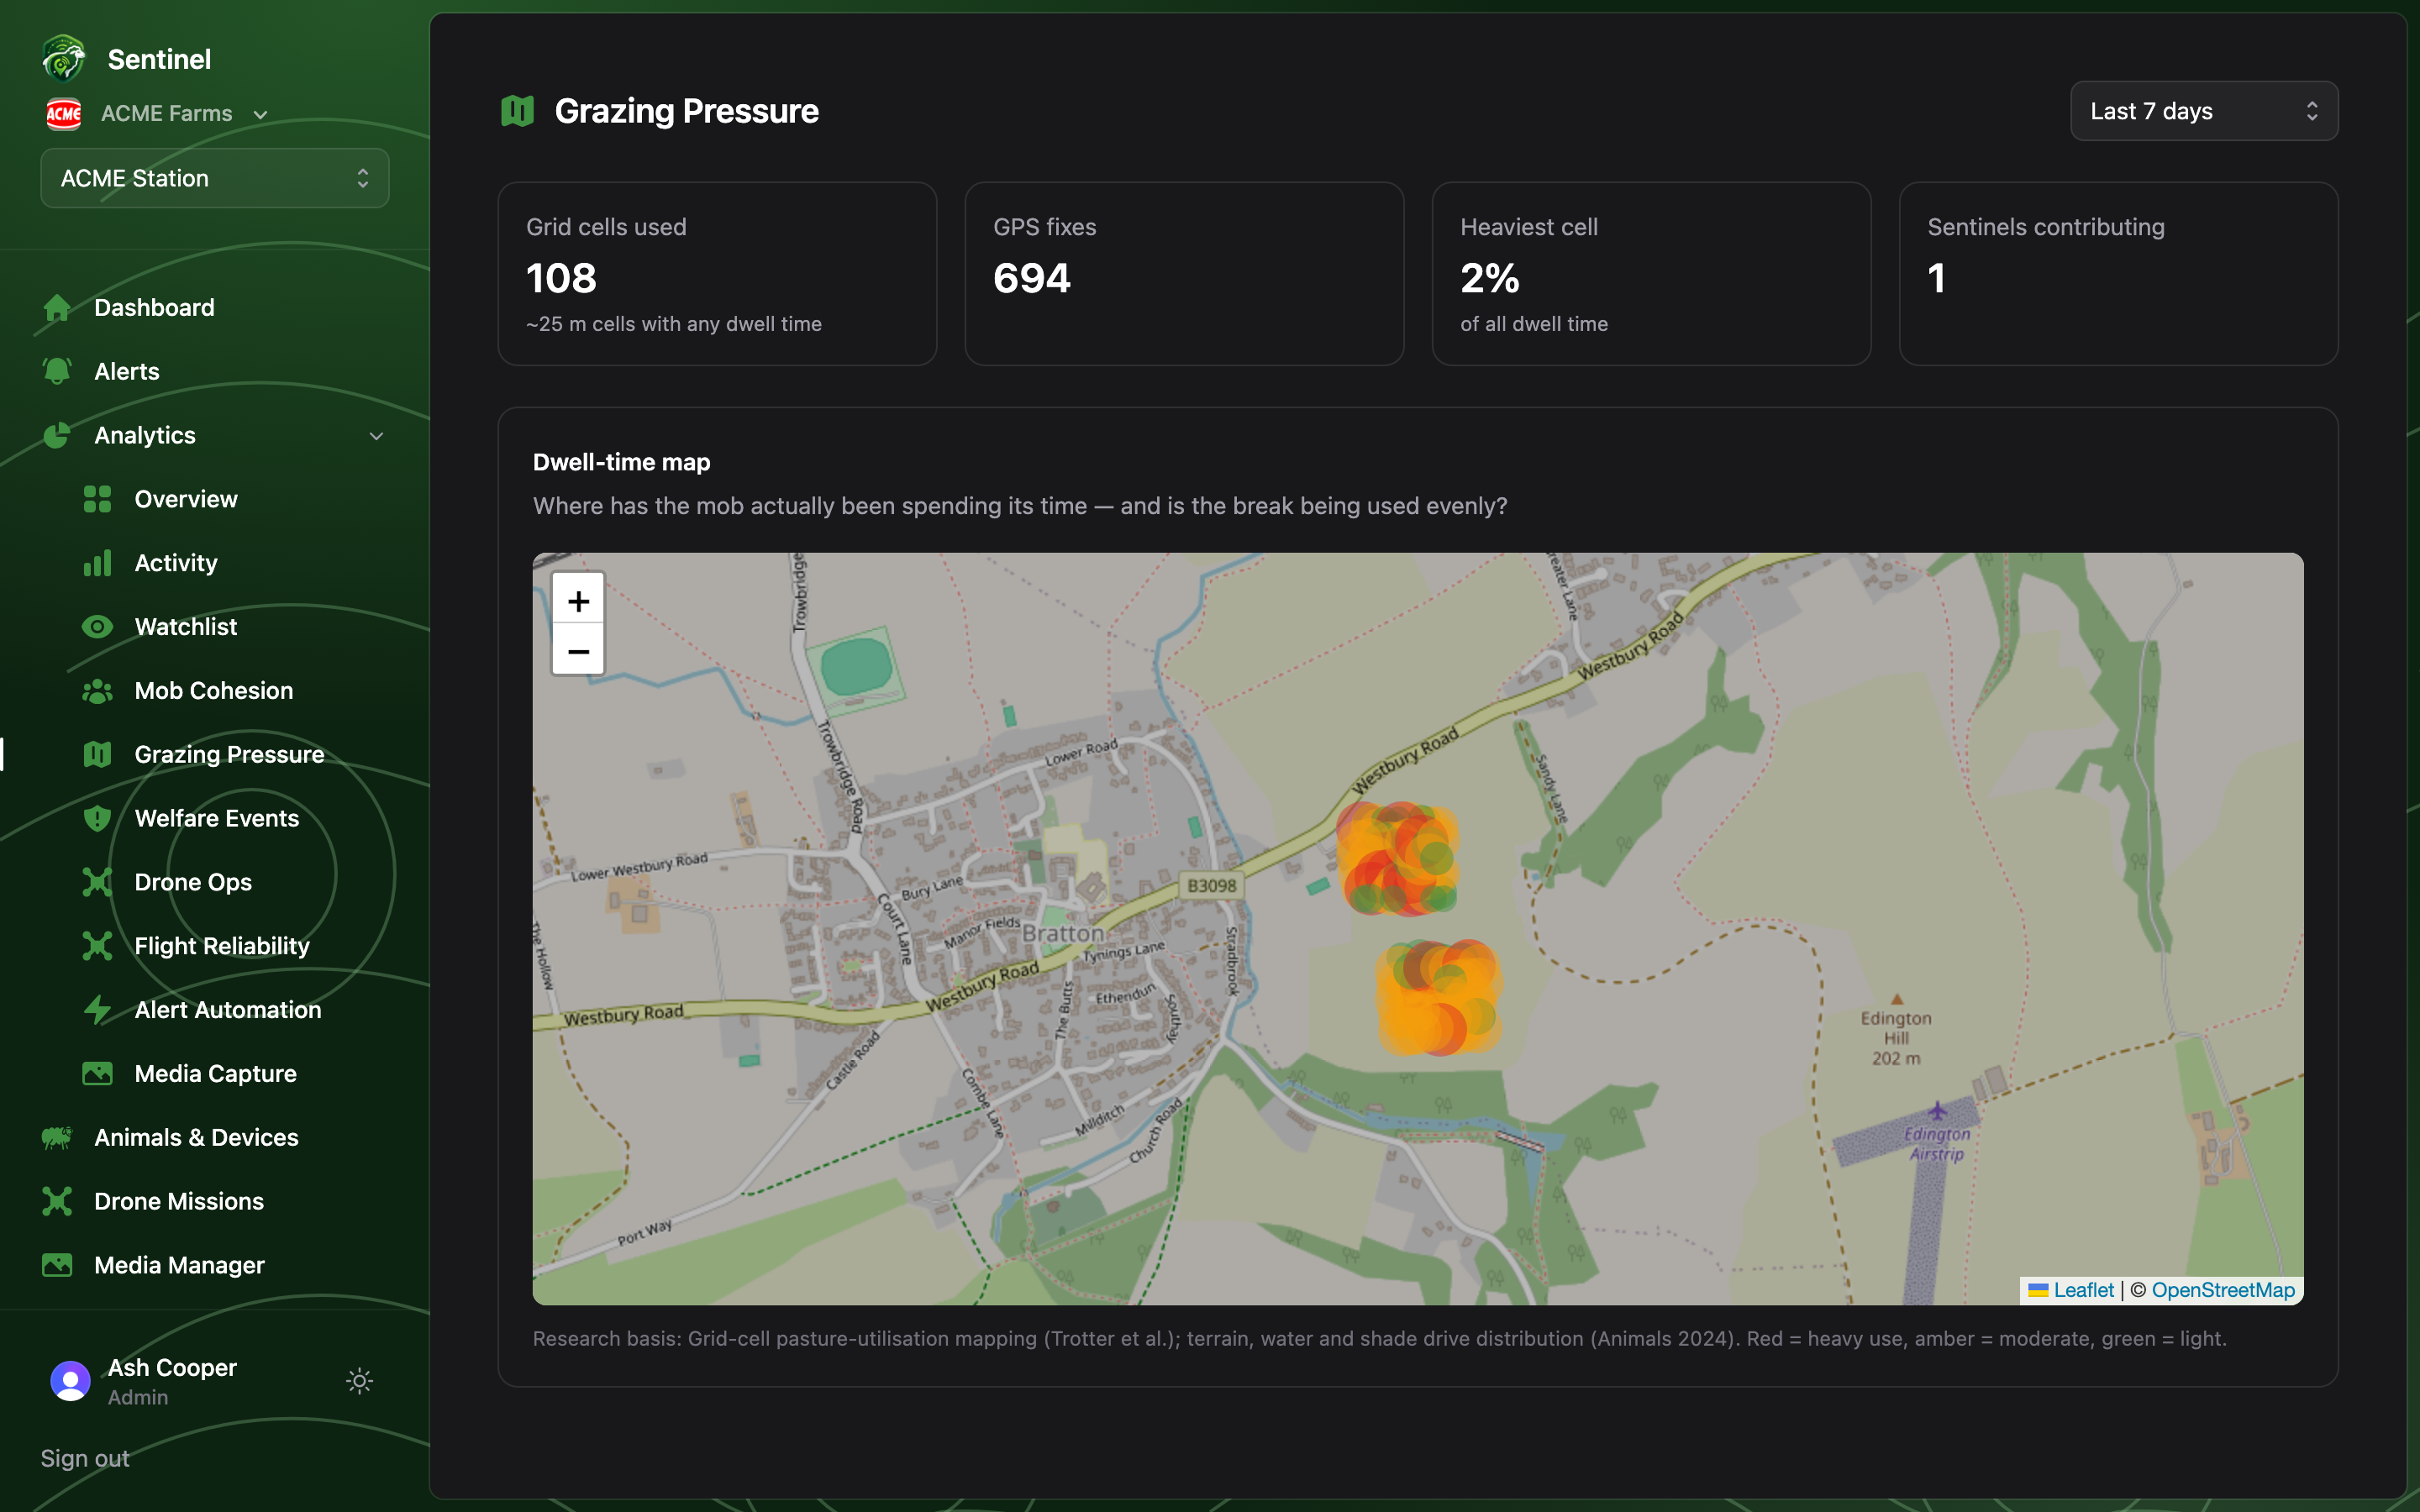
Reading the map
The farm is divided into ~25 m cells; each circle is a cell the mob dwelt in, sized and coloured by pressure — red heavy, amber moderate, green light. Click a circle for the fix count and how many animals contributed. The stat cards summarise the window: cells used, GPS fixes, the heaviest cell (with a nudge to consider rotating when one cell takes more than a quarter of all dwell time), and how many sentinels contributed.What to do with it
- A hot cluster on one face with untouched country next door is a rotation prompt — the map shows sub-paddock patterns fences can’t.
- Persistent pressure around water or shelter is normal; pressure building on a slip-prone face isn’t.
- Compare the 7-day and 30-day views: the short window shows the current break, the long one shows the season’s pattern.
Only sentinel collars carry GPS, so this is the mob envelope, not per-animal
tracking — with a sentinel per 10–20 ewes the dwell picture is representative of
where the mob grazed.