

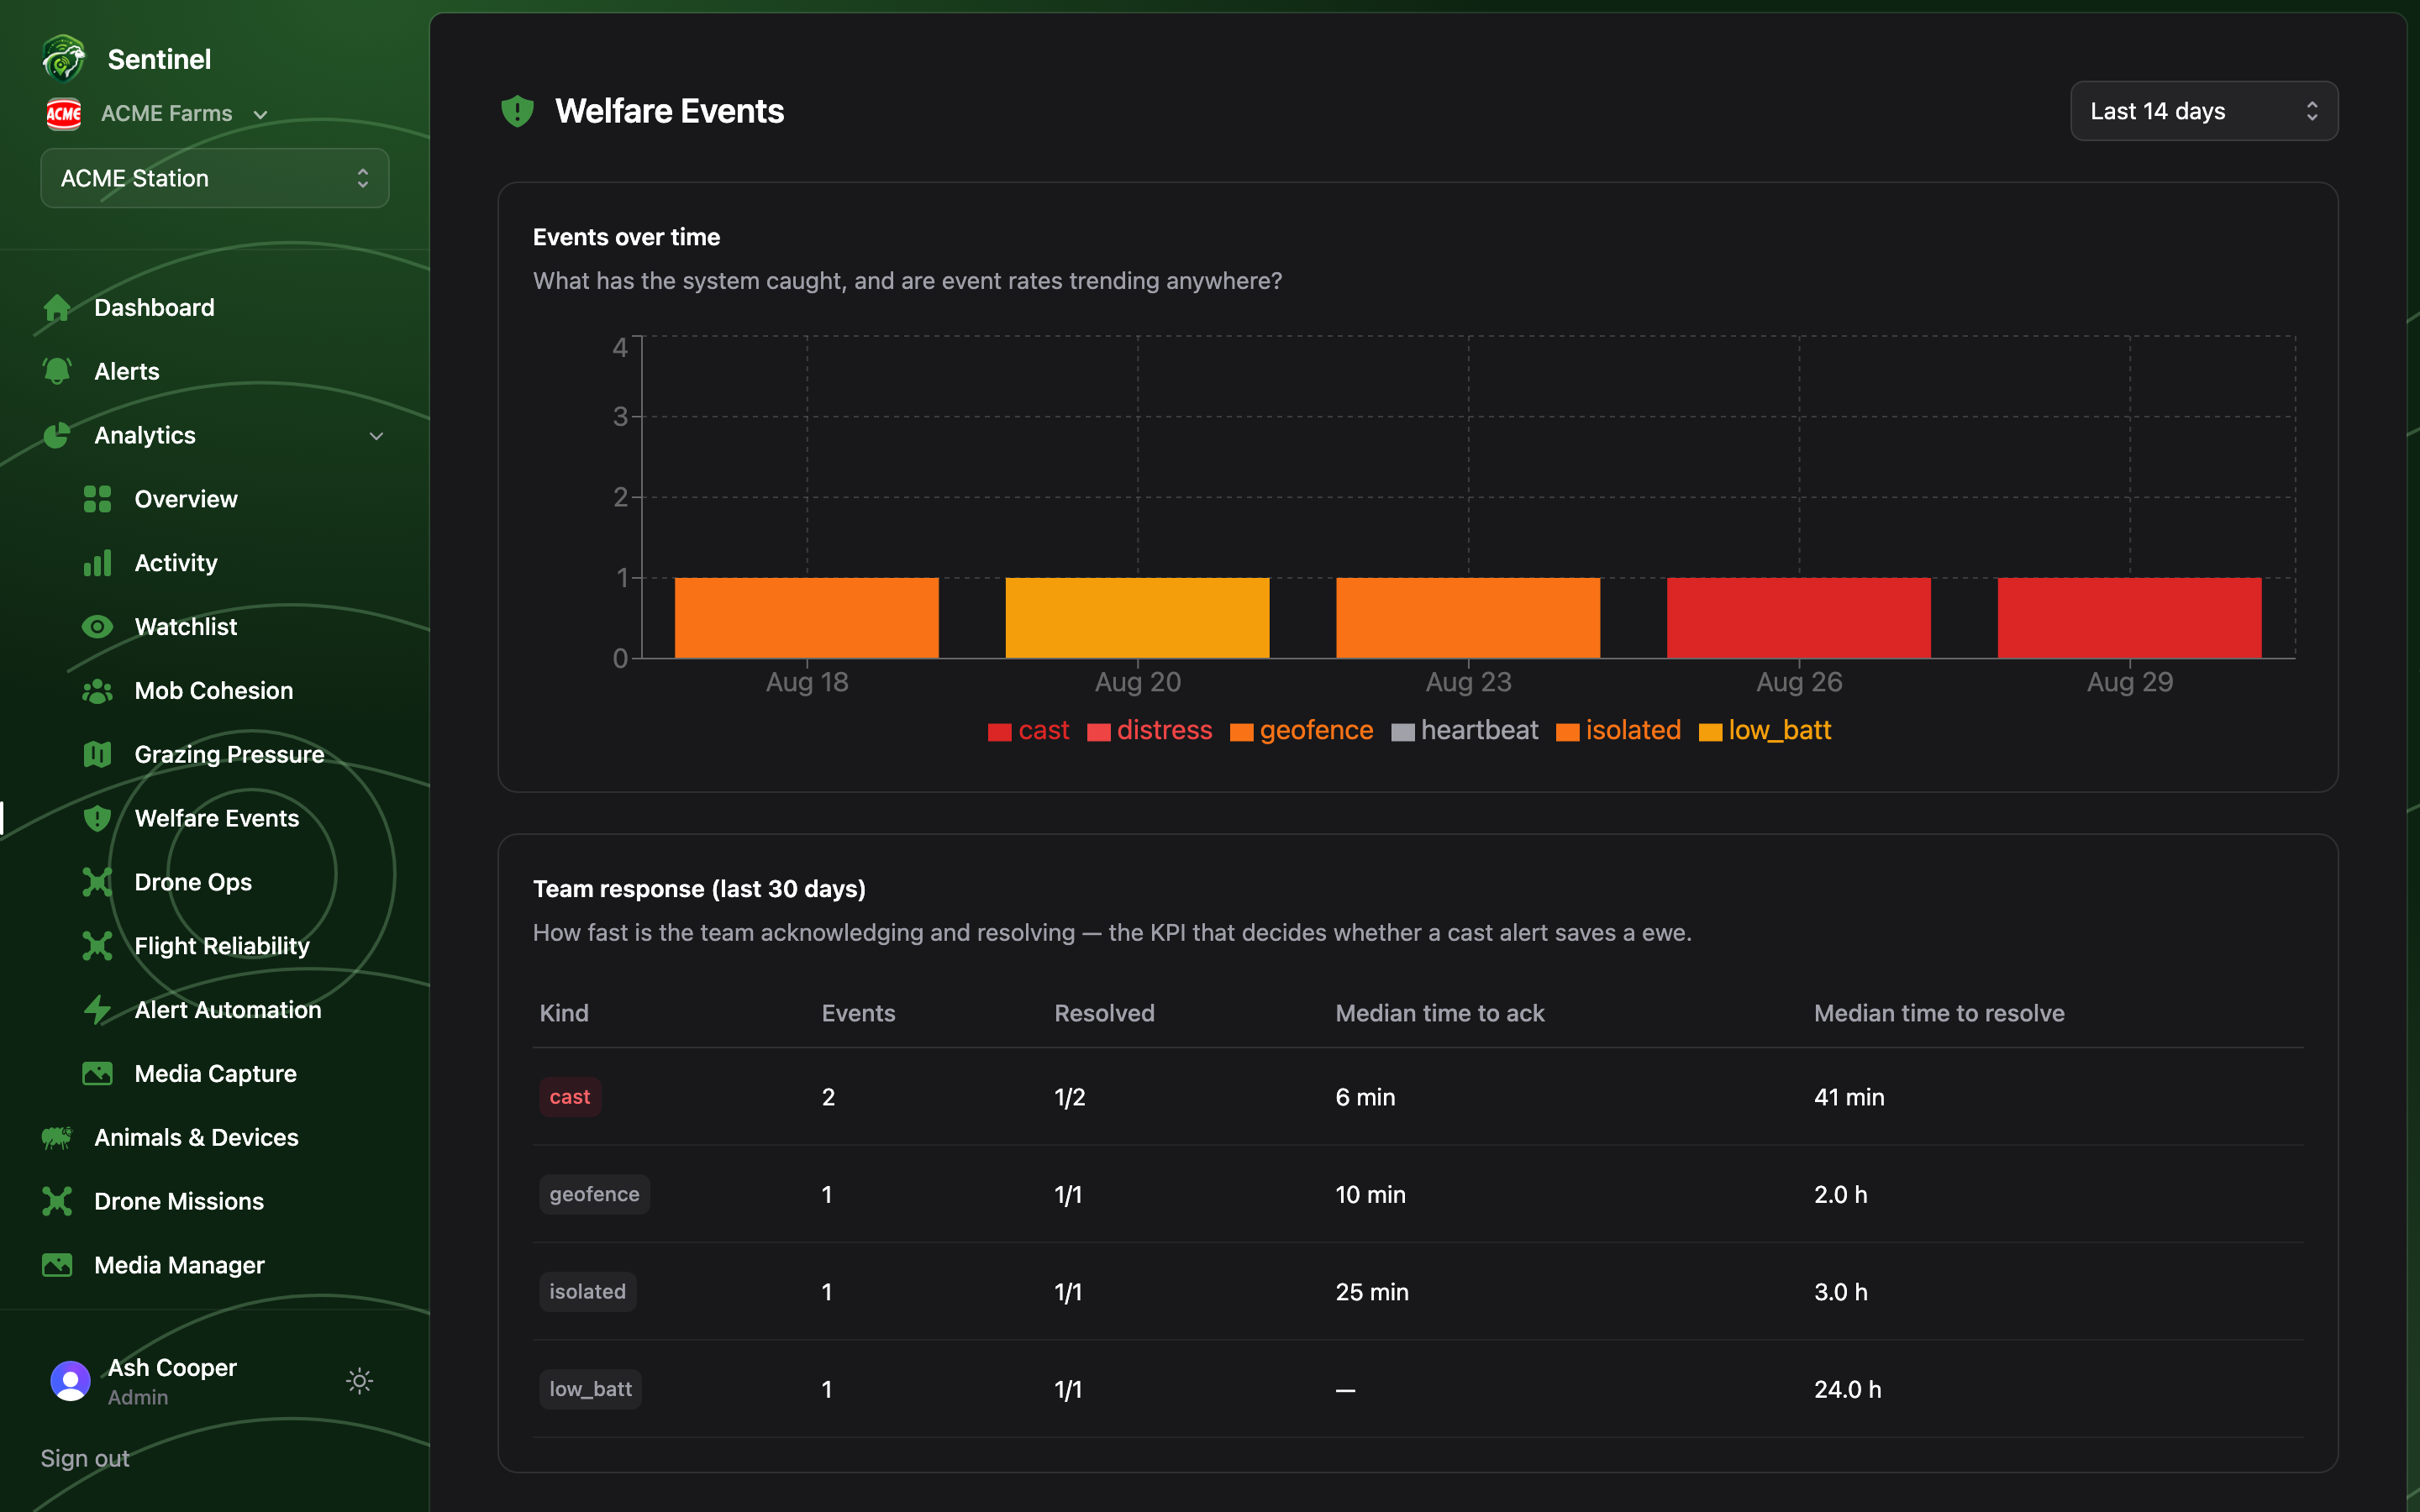
Welfare Events is the accountability page: what the system raised, and how the team responded.
Welfare Events: stacked alerts-per-day chart and the team-response table

Events over time

A stacked bar per day of alerts by kind — cast, distress, isolated, geofence, low battery, heartbeat. Spikes tell stories: a cast cluster after shearing, geofence noise after a fence went down, a low-battery wave when a device batch ages out.

Team response

The response table (always the last 30 days) shows, per alert kind: how many events, how many were resolved and as what, and the median time to acknowledge and median time to resolve. These medians come straight from the resolve flow — which is why resolving alerts properly, false alarms included, matters.
The number to watch is median time-to-resolve on cast alerts. A cast ewe’s survival window is measured in hours; if that median creeps up, the alert → response chain (who gets the webhook, who’s on the hill) needs attention — see the Alert Manager.