

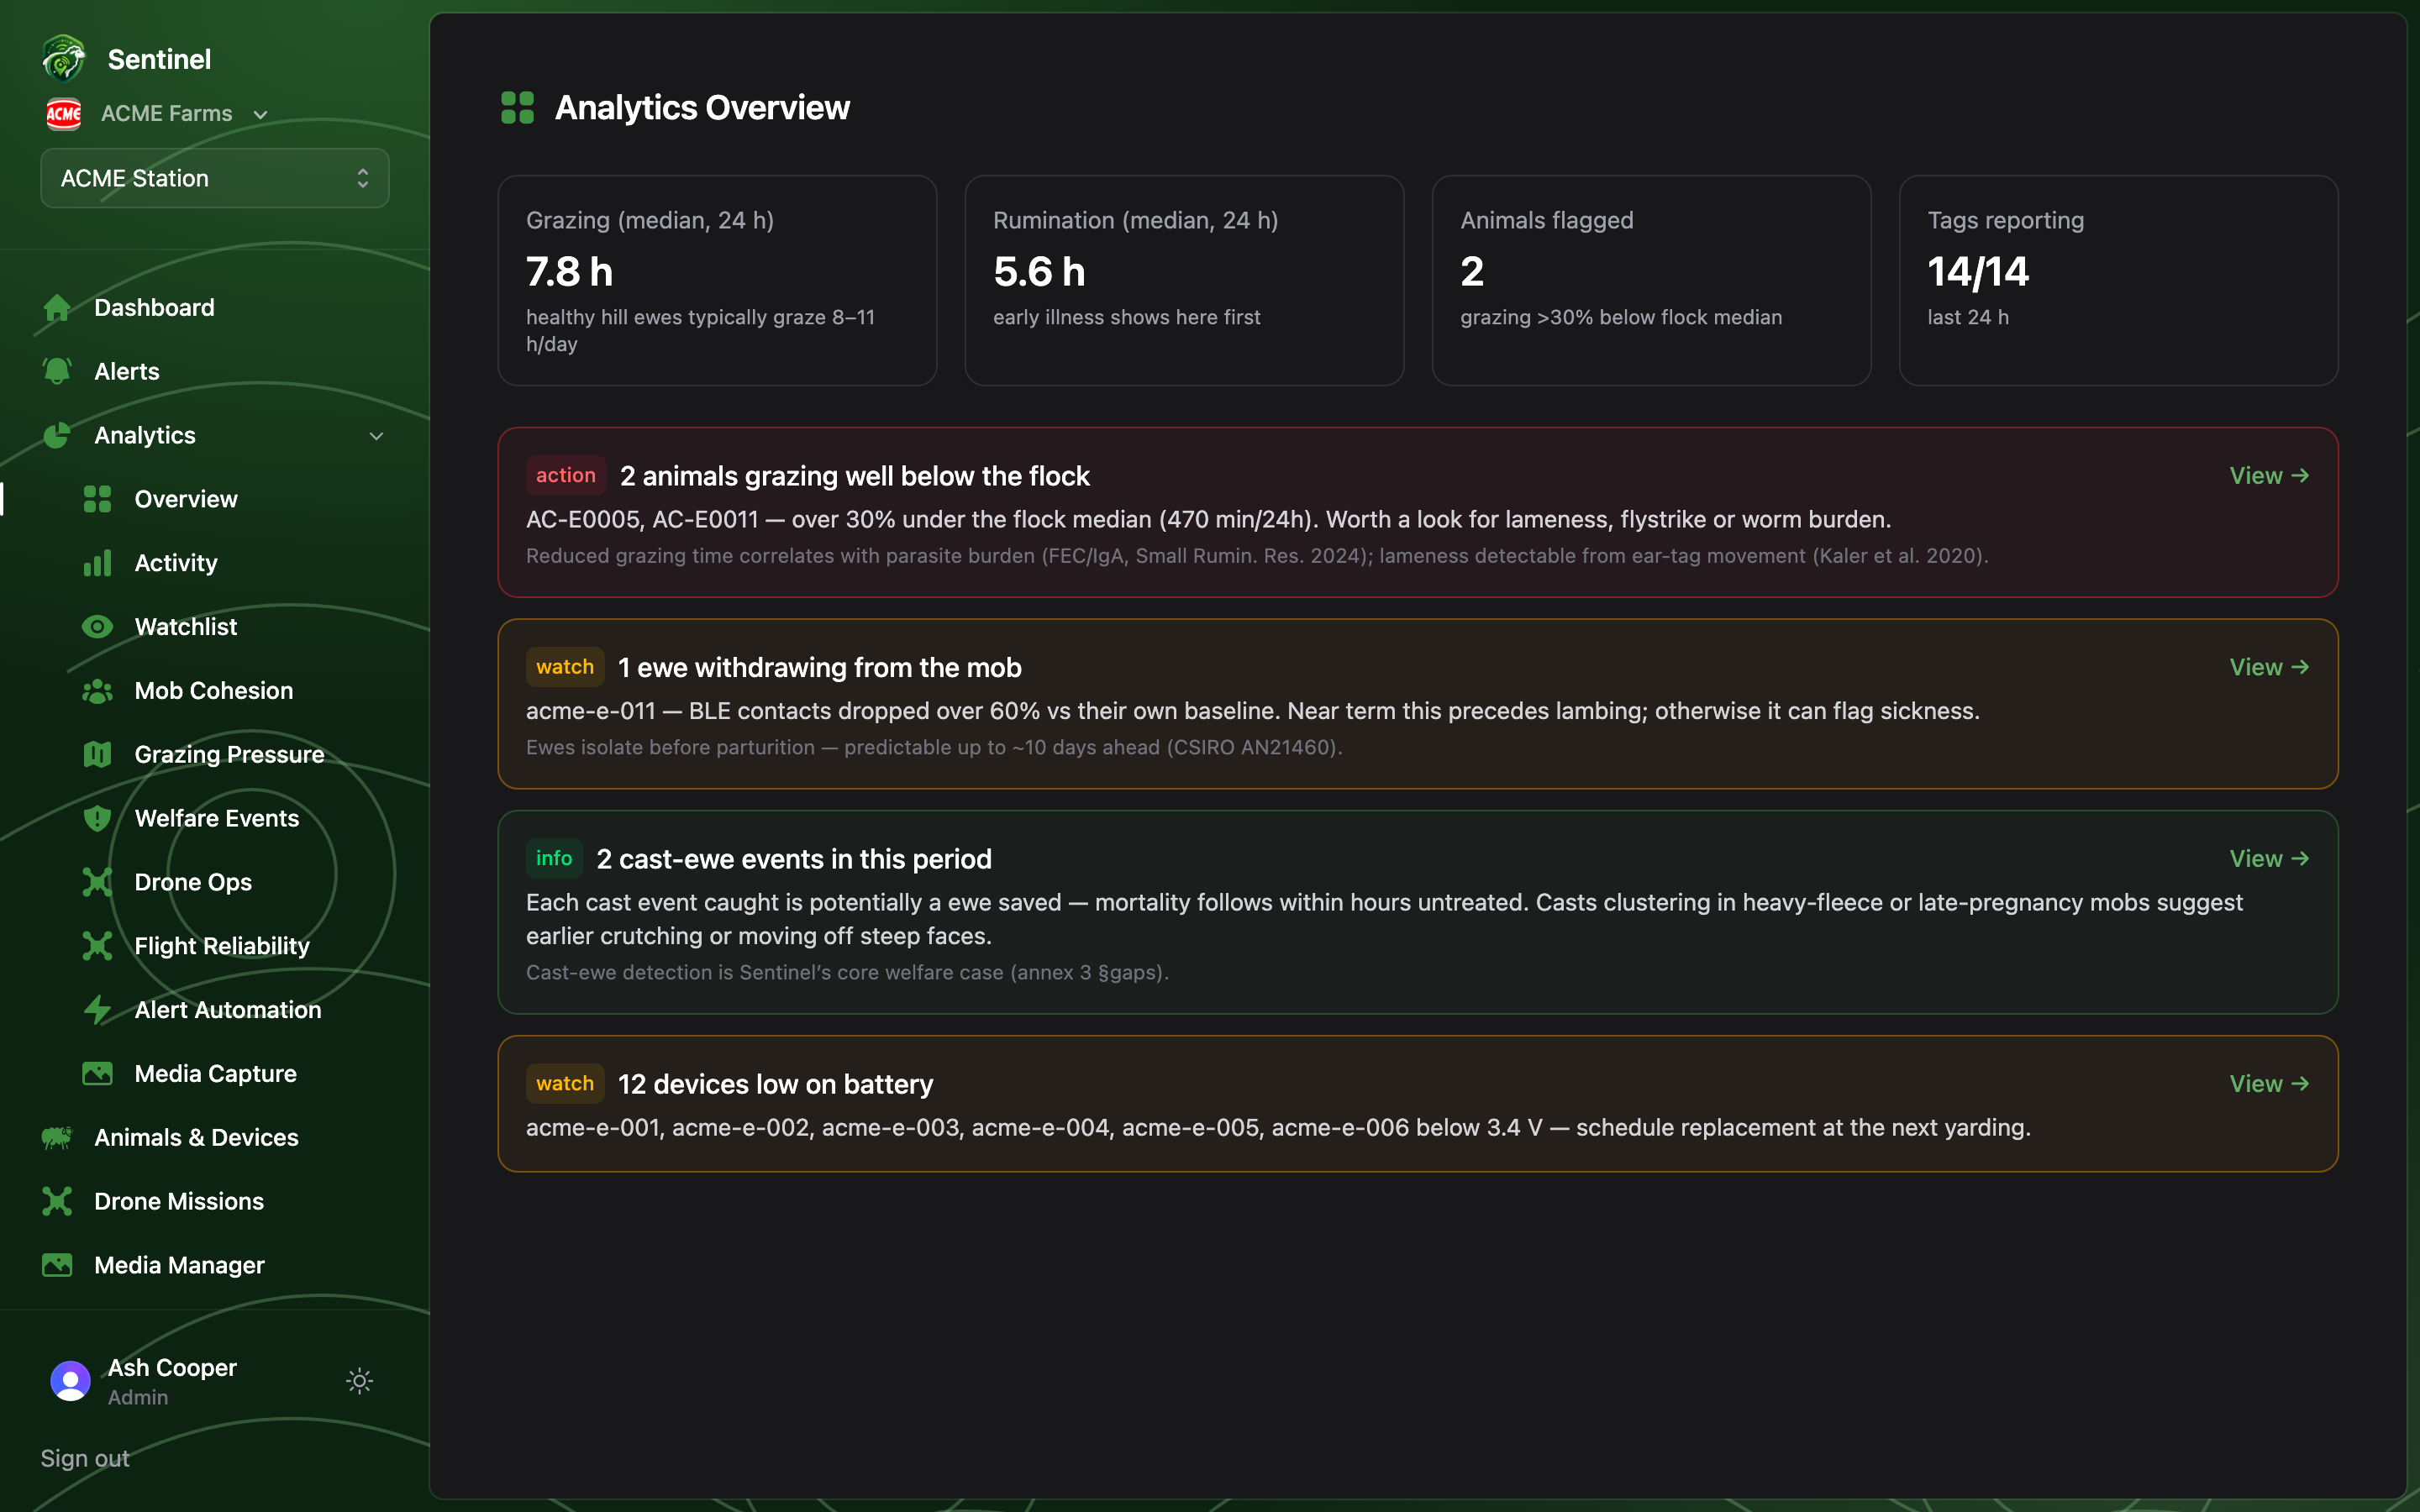
The vital signs
- Grazing (median, 24 h) — healthy hill ewes typically graze 8–11 h/day.
- Rumination (median, 24 h) — early illness shows here first.
- Animals flagged — grazing more than 30% below the flock median.
- Tags reporting — how much of the flock you actually heard from in 24 h.
Insight cards
Each card is a finding computed from the last fortnight’s data, badged by urgency — action (red), watch (amber), info (green) — with the research basis it rests on and a View → link to the analytics page with the detail. When nothing is off, the overview says so: “No anomalies detected — activity, rumination, social contact and grazing spread all look within normal range.”The rest of the section
Activity
Daily activity budgets and the diel (around-the-clock) pattern.
Animal Watchlist
Who to walk to first, ranked worst-first.
Mob Cohesion
BLE-contact social structure and who is drifting away.
Grazing Pressure
Dwell-time map — where the country is being hammered.
Welfare Events
Alert trends and how fast the team responds.
Drone & automation
Drone Ops, Flight Reliability, Alert Automation and Media Capture.
Most analytics pages share a time-range filter — Last 7 / 14 / 30 days — at the
top right. The Overview and Watchlist always look at the recent window that matters
for triage.