

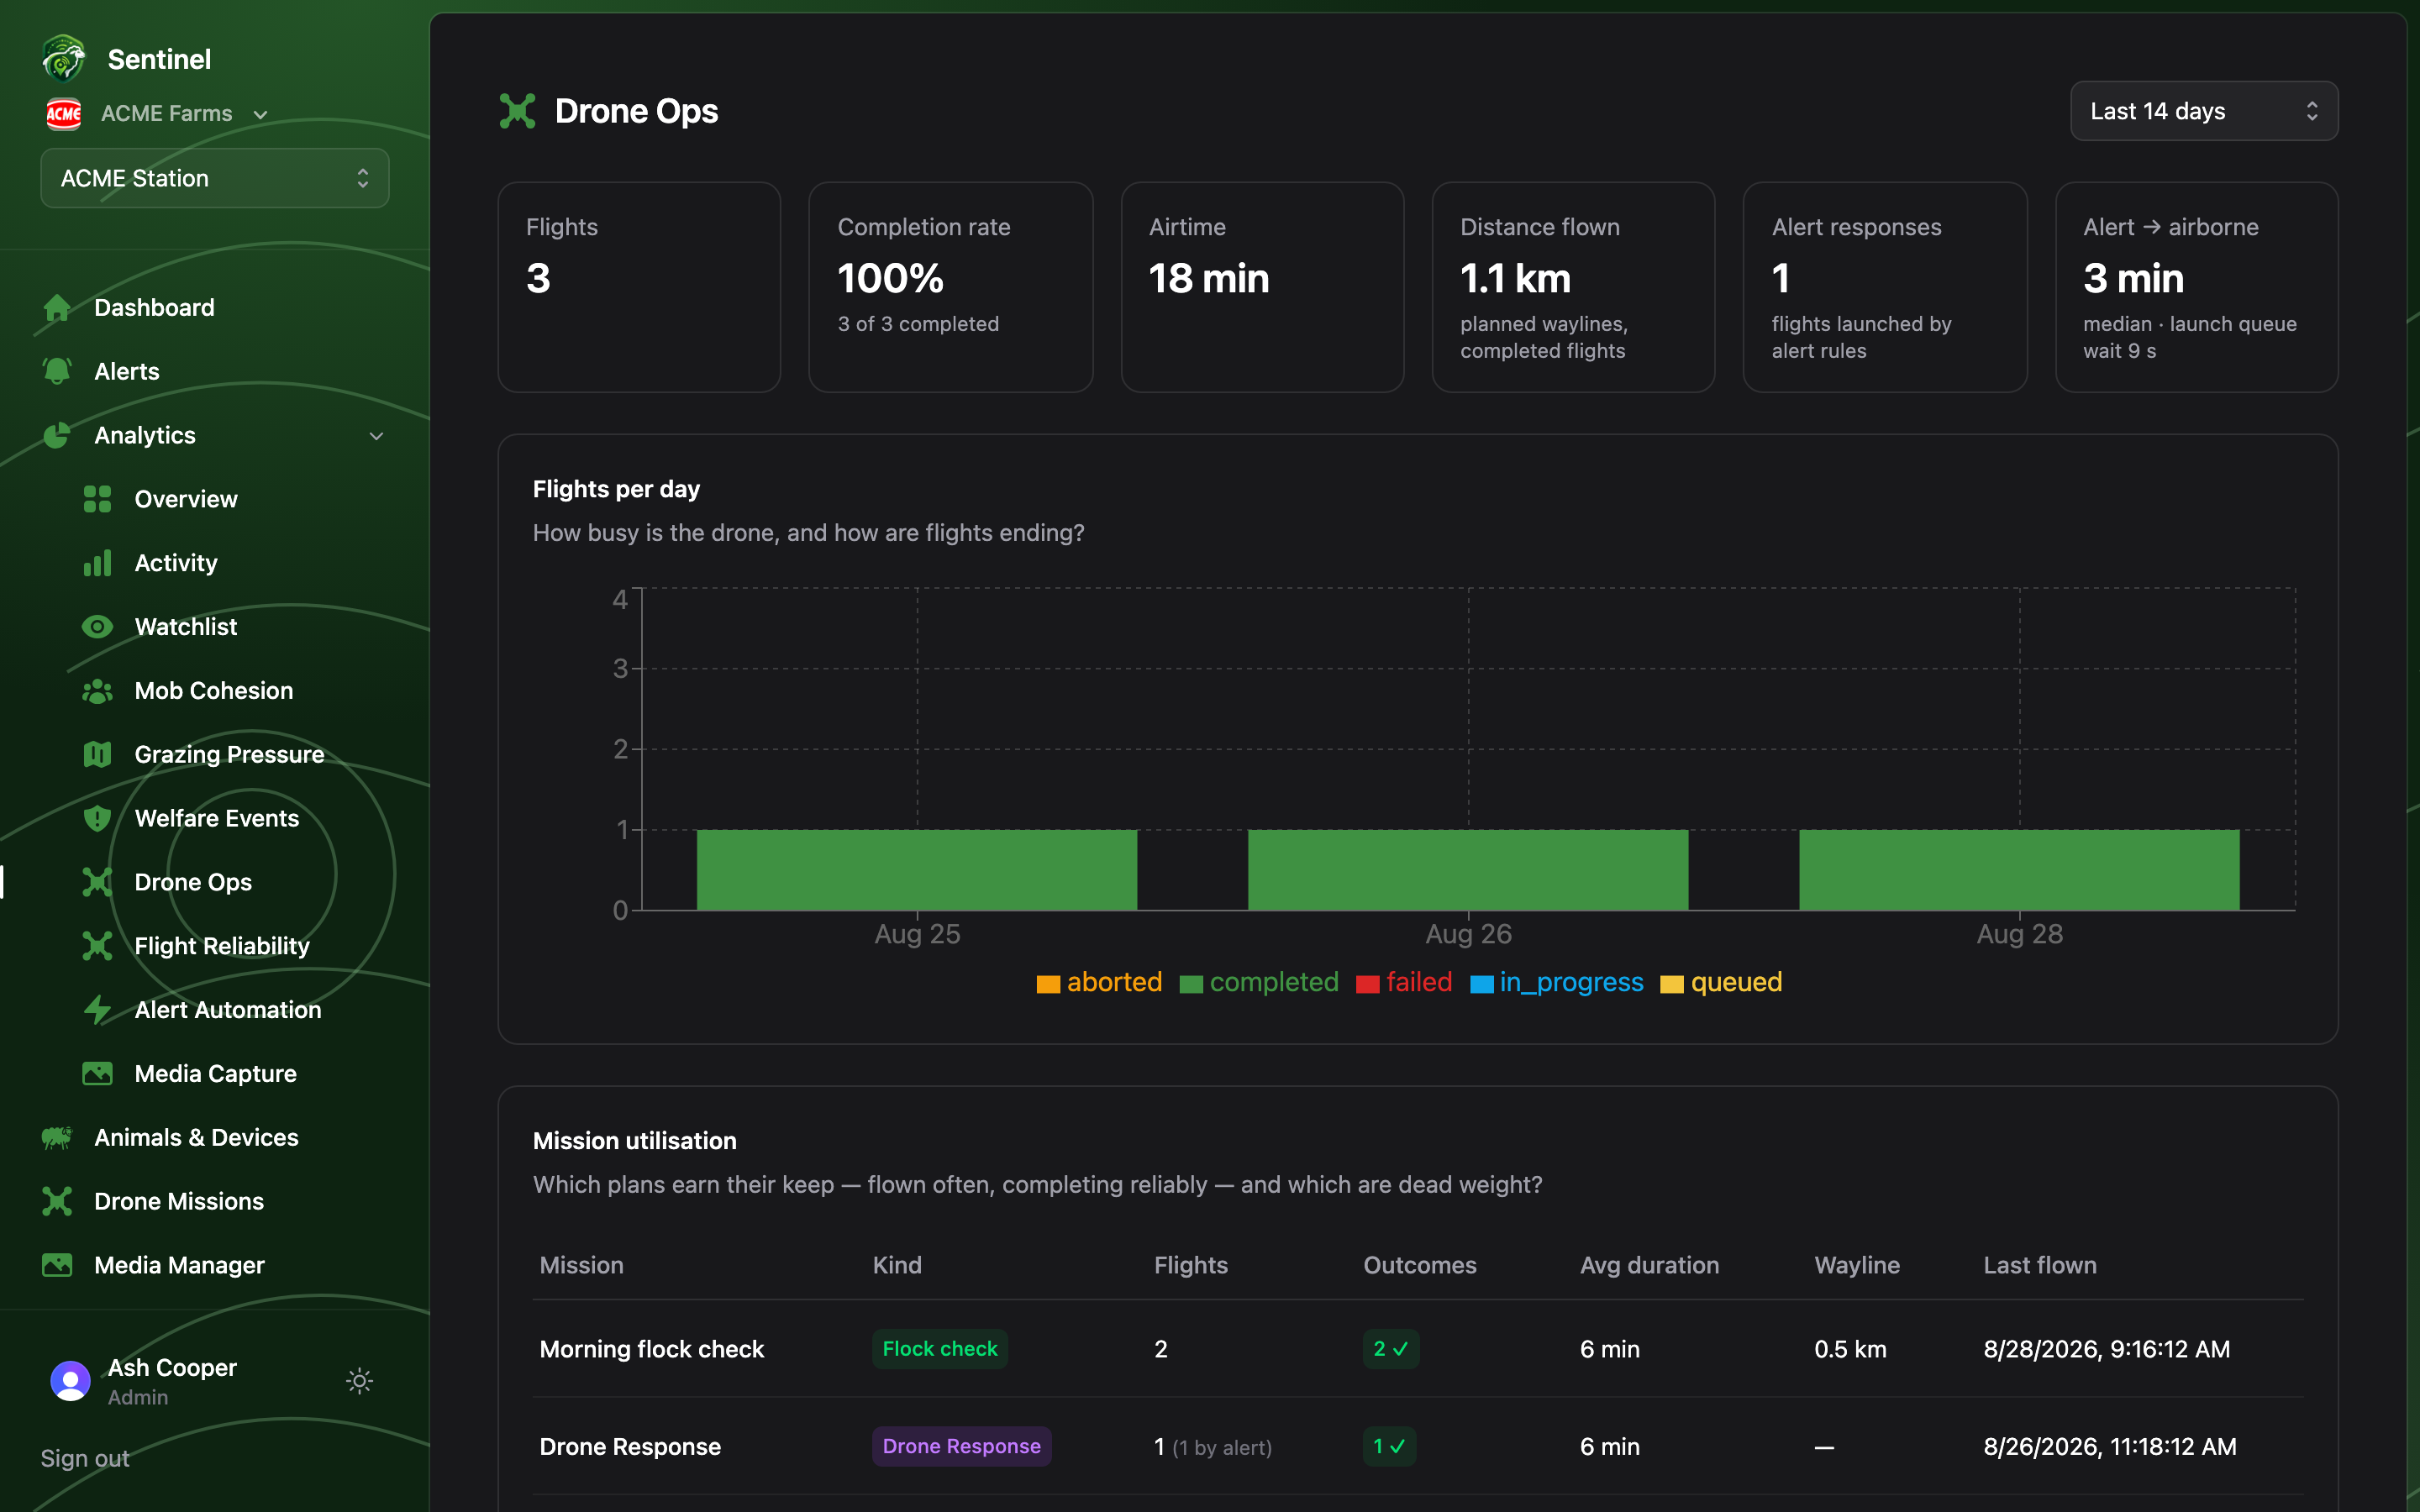
Drone Ops is the operational summary of the missions programme: how much flying happened, how reliably, and what the automated alert-response chain achieved.
Drone Ops: flight stat cards, flights-per-day chart and mission utilisation table

The headline cards

Flights flown, completion rate, total airtime and distance flown (planned waylines, completed flights) — plus the two automation numbers:
  • Alert responses — flights launched by alert rules rather than a person.
  • Alert → airborne — the median time from an alert landing to the response drone being in the air, with the launch-queue wait broken out.

Flights per day

A stacked bar per day by run outcome (completed, aborted, failed, in progress) — the quickest way to see whether a rough patch was one bad day or a trend.

Mission utilisation

Per mission: how many flights (and how many were alert-triggered), the outcome tally, average duration, wayline length and last flown. Missions marked never flown are plans nobody uses — candidates for pruning or a rethink. For where in the flight things go wrong — per-stage aborts, battery per km — see Flight Reliability.